The numbers colleges publish, and the ones they don't
Colleges publish plenty of figures about their students, but rarely the one families most want: who gets in at each GPA. Here is what the published numbers really describe, where they mislead, and what to ask instead.
Every year, most colleges fill in a long form called the Common Data Set. It covers admit rates, test scores, GPAs, deadlines and much more. It is the single best source of college numbers, and we use it for almost every college in Admissionist.
But the numbers in it answer a different question from the one families are asking. Families want to know: will a student like mine get in? The published numbers mostly answer: what do the students who came here look like? Those are not the same thing.
Enrolled is not admitted
The GPA and test score figures colleges publish describe students who enrolled, not everyone who was admitted.
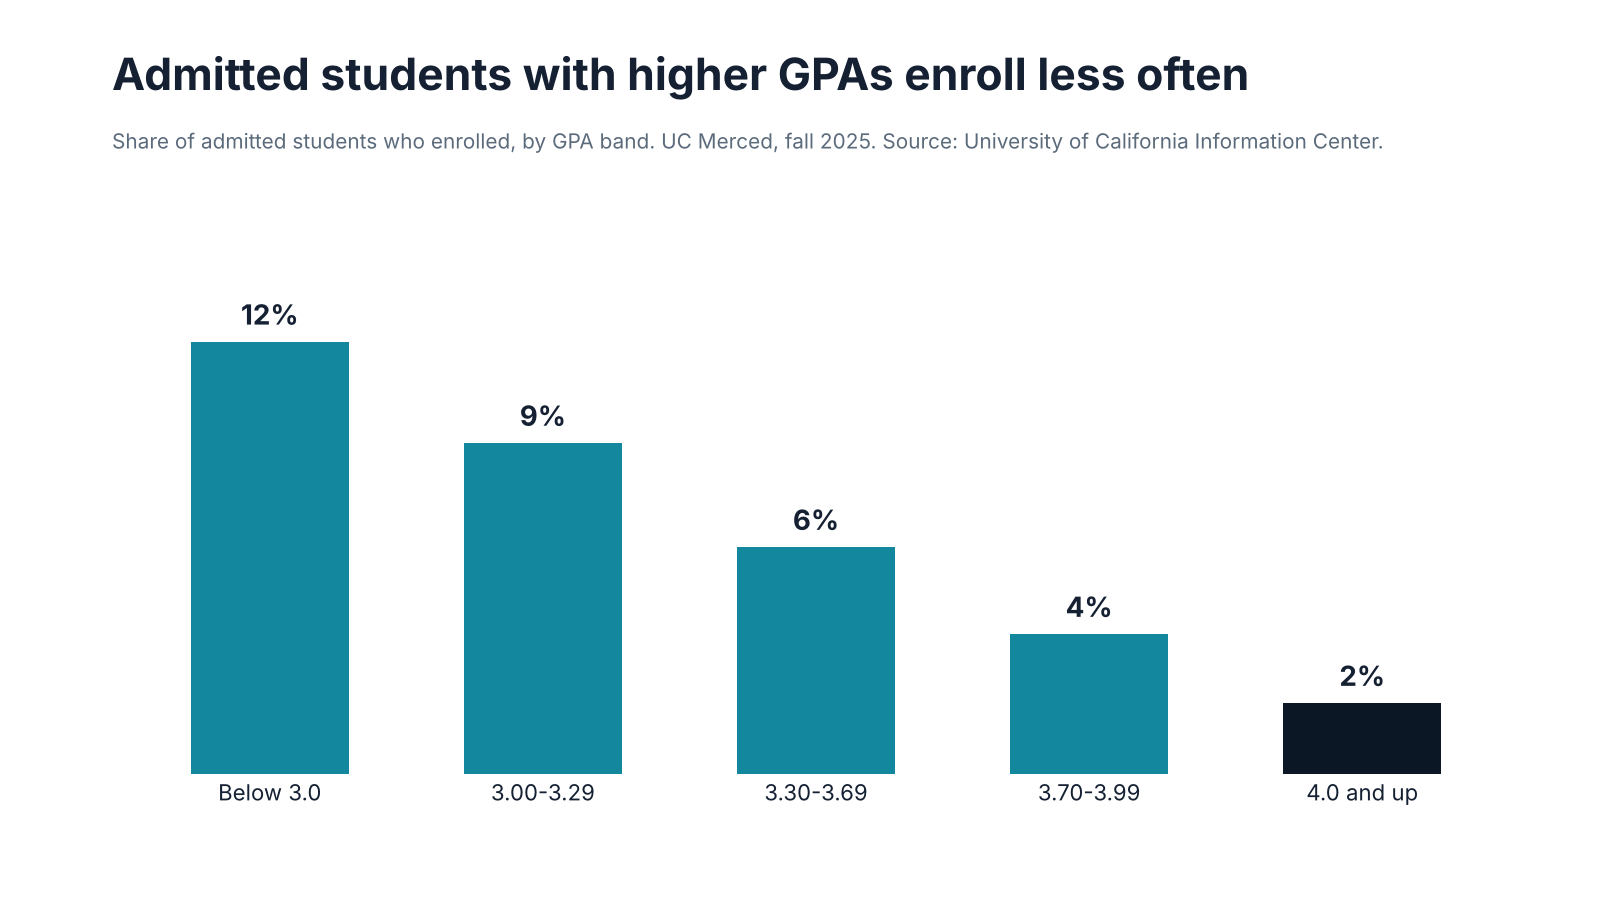
That matters because admitted students do not all enroll at the same rate. Students with higher GPAs usually have more offers, so fewer of them say yes to any one college. The chart above shows it at UC Merced in fall 2025: about 12% of admitted students below a 3.0 GPA enrolled, against about 2% of those at 4.0 and up.
So the students who arrive are a lower-GPA group than the students who were admitted. If you compare yourself with the enrolled group, a college looks easier to get into than it is, and it looks easiest for exactly the students who are closest to the line.
How big is the gap? At the University of California, where both groups are published, the admitted group's GPAs sit clearly higher than the enrolled group's, by a similar amount every year. The University of Georgia's yearly profiles show a similar gap. We correct every college's published mix by that amount before comparing.
Weighted or unweighted?
A 3.8 can mean very different things. On an unweighted scale it is mostly A's. On a weighted scale, where honors and AP classes earn extra points, it might be a B+ average.
Colleges don't always say which they used. Some publish an average GPA that is impossible on a 4.0 scale, which settles it. Others leave you to guess. We check each college's figures to see which scale they must be on, and compare the matching GPA from your profile. If your school gives you both, enter both.
Test scores: only the students who sent them
At a test-optional college, the published middle 50% of SAT or ACT scores describes only the students who chose to submit scores. Students with lower scores often keep them to themselves, so the published range runs high. A score just below that range may be closer to typical than it looks.
The number that is almost never published
What families really want is a simple table: of the applicants with a GPA like mine, how many got in? Almost no colleges publish it. The University of California does, for every campus and every year, and it is the most useful admissions data we have found. Where a college publishes a table like that, Admissionist uses it directly instead of an estimate.
Some state systems publish something close: firm minimum GPAs and test scores below which applicants are generally not admitted. We cover those in a separate post.
What you can ask a college
Admissions offices are often happy to answer questions the published figures leave open. Good ones to ask:
- Is the GPA you publish weighted or unweighted? And do you recalculate it from my transcript?
- Do you publish admit rates by GPA, or can you tell me roughly how applicants with my GPA usually do?
- Is there a minimum GPA or test score below which applicants are rarely admitted?
- For test-optional applicants, how do admit rates compare with those who sent scores?
- Do early applicants get in at a higher rate, and is that because the early group is stronger?
Write the answers down. They are worth more than any calculator, ours included.
Sources
- Common Data Set Initiative, Common Data Set (sections C1, C9, C11 and C12).
- University of California Information Center, Undergraduate admissions summary: applicants, admits and enrollees by GPA band, fall 2022 to fall 2025.
- University of Georgia, Office of Undergraduate Admissions, first-year class profiles.
- Admissionist, How Fit and Chance work (November 2026).
Figures and rules change. Always confirm deadlines, requirements and costs on each college's own website.
See where you stand
Enter a GPA, a test score and your state to see your Reach, Target, Safety and Pass colleges.
Try it free