Why your odds aren't a bell curve: the GPA line most colleges never publish
At most colleges the chance of getting in climbs steeply across a narrow band of GPAs. Here is what that looks like in real admissions data, and why it matters if your grades sit near the line.
A college's admit rate is an average. It tells you what share of all applicants got in. It does not tell you what happened to applicants like you.
Most chance calculators fill that gap with a simple picture: the further your grades and scores sit below a college's typical student, the lower your chance, sliding smoothly down a bell-shaped curve. It is a tidy picture. Real admissions data does not look like it.
What the data shows
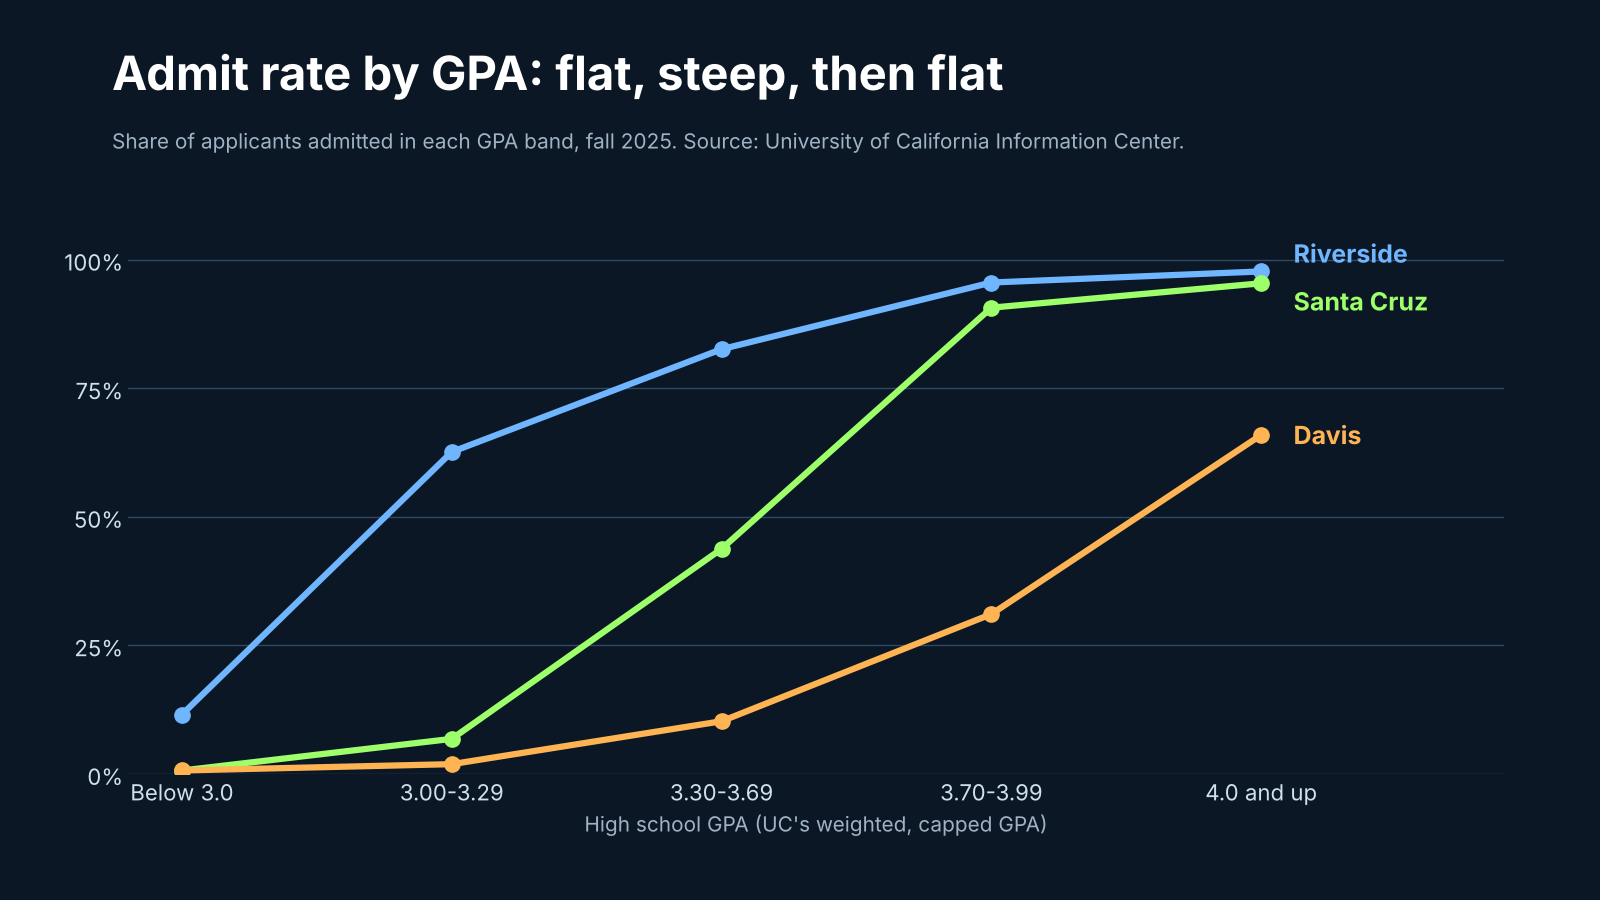
The University of California is one of very few college systems that publishes how many applicants it admitted in each GPA band, campus by campus. The chart above shows three campuses for fall 2025.
Look at Santa Cruz. It admitted about 73% of all first-year applicants. But that average hides three very different stories:
- Below a 3.0 (on UC's weighted, capped GPA), fewer than 1 applicant in 100 was admitted.
- From 3.00 to 3.29, about 7 in 100.
- From 3.30 to 3.69, about 44 in 100.
- From 3.70 up, more than 90 in 100.
That is not a gentle slope. It is flat at the bottom, climbs steeply across a few tenths of a GPA point, and flattens again at the top. Riverside does the same thing at a lower GPA, and Davis at a higher one. Each campus has its own line.
Studies of Virginia's public universities and court records from the University of North Carolina and Harvard show the same shape: a narrow band where admission goes from unlikely to likely.
Why the shape matters
If your grades sit well above a college's line, the shape hardly matters: you are likely to get in either way. If they sit well below, the same is true in reverse.
It matters most when you are near or under the line. A smooth curve spreads the chance out, so a student a little below a college's typical range still sees a healthy number. The real pattern is harsher. Being 0.3 below the line can mean the difference between a coin flip and a long shot.
Here is a real example from our own tool. A student with a 2.85 unweighted GPA and a 1160 SAT, applying to the University of Oregon from out of state, where the published admit rate is 89%. An earlier version of Admissionist, built on the smooth-curve idea, put their chance at 59%. That sounds about right next to an 89% admit rate. But only about 5% of Oregon's first-years have a GPA below 3.0, and Oregon says applicants generally need a 3.0. Our current model, built around the line, puts the same student at 35-40%. Still a real chance, but no longer a Safety.
Finding a line no one publishes
Most colleges never publish their line. So we work it out.
Every college publishes two things that pin it down: its admit rate, and the share of its first-years in each GPA band. If a college admits 89% of applicants and almost all of its students have a GPA above 3.0, then nearly all of its applicants must have been admitted above 3.0 too, and few below. Only one position for the line makes the numbers add up, and we solve for it, college by college, for in-state and out-of-state applicants separately where a college publishes both rates.
How steep the climb is across the line, we learned from UC itself: four years of applicants, admits and enrollees at all nine undergraduate campuses. Fitted that way, our predictions for each UC campus and GPA band are off by about 2 percentage points on average. Run only from the kind of figures every college publishes, they are off by about 6, against 15 for our old smooth-curve model.
What to do with this
- Look at where most of a college's students sit, not just its admit rate. A high admit rate with almost no students below your GPA is a warning sign.
- Read the GPA mix, if the college publishes it. It is in section C11 of the college's Common Data Set: the share of first-years in each GPA band.
- Know which GPA the college means. Some report weighted GPAs and most report unweighted ones. Comparing the wrong one can put you on the wrong side of the line.
- Don't let one number decide. A college can still say yes below its line. Essays, activities and context matter, especially at colleges that read every application closely.
In Admissionist, every college's Admission tab shows where its estimated line sits, how far above or below it you are, and which GPA we compared.
Sources
- University of California Information Center, Undergraduate admissions summary: applicants, admits and enrollees by GPA band, fall 2022 to fall 2025.
- University of Oregon, Common Data Set (GPA bands, section C11) and admissions requirements.
- Center for Equal Opportunity, admissions at Virginia public universities (2019).
- Trial records in Students for Fair Admissions v. University of North Carolina and v. Harvard College (admit rates by applicant decile).
- Admissionist, How Fit and Chance work (November 2026).
Figures and rules change. Always confirm deadlines, requirements and costs on each college's own website.
See where you stand
Enter a GPA, a test score and your state to see your Reach, Target, Safety and Pass colleges.
Try it free